Thursday, September 23, 2010

Oracle Open World Trip - Day 3

Saturday, September 18 was basically an off-day (or a travel day) for most Open World attendees, but it was one of the best days of my life.

My wife and I stayed out in the East Bay with my best friend from college, Mark, who is the chief pilot for North Face.  Mark and I are both die-hard Michigan football fans, so we got to watch the Michigan game together.  We did not, however, expect the game to be such a thriller, so my adrenaline was running high during and after the game, but the best adrenaline rush was yet to come.

After the game we drove down to Livermore airport to meet with one of my customers, Tony Banta.  Tony is quite an interesting guy in that he was an air force test pilot, was in the astronaut corps, and later went on to be the director of worldwide manufacturing for Cisco Systems.  His current company, Calix, recently implemented Dodeca for production forecasting and Tony raves about the cost savings it has generated.   In fact, he gave us this quote:

"Dodeca can answer simply the questions that can't be answered simply"


He was literally talking about their implementation and said that line; I stopped him so I could write it down word-for-word.

Tony and I also get along because he is also a pilot.  I have a pretty cool plane, a Cessna 210, but Tony has some really cool planes.  Saturday afternoon I got to fly in one of them.  Here is a video my wife, Darlene, took when we flew over them after takeoff.  The best part of the video, frankly, is her scream and laugh..


In case you don't recognize the plane, it is a P-51 Mustang which is the airplane that saved Europe in WWII.  A picture of one of these airplanes has hung over my desk for many years now as a reminder to work hard so I can earn one, but this is the first time I have actually been in one.  My laptop machine name is Mustang.  This flight confirms it..  I want one!  I told my wife I will now have to double the hours I work (from 12/day) in order to earn one..

I will post more video from the ride after Open World.

Sunday, September 19, 2010

Oracle Open World Trip - Days 1 and 2

I have blogger credentials for Oracle Open World 2010 and thus hope to do at least daily posts.

My trip started earlier in the week with the Oracle ACE Directors meeting at Oracle corporate headquarters. The ACE Directors meeting gives Oracle an opportunity to gather all of the ACE Directors together for a couple of reasons:
  • To communicate upcoming announcements at Open World.
  • Give this group of experts in the Oracle community an opportunity to talk directly with the appropriate Oracle executives to better understand Oracle's direction and to give feedback from the community directly to Oracle management.
Of course, this session was under NDA but there are a couple of things that are very apparent..  First, Oracle is committed to the future of Java (and to it's future as open source) and will make announcements at Open World to show their commitment.  

Second, the Hyperion applications look to me like they will be integrated into WebCenter; Hyperion Financial Close Manager already requires it if I am not mistaken.  WebCenter is essentially the Oracle equivalent of Microsoft Sharepoint and will add good value to the stack.

Friday, September 17, 2010

Relational Functionality of Dodeca 5.0 - How To, Part 3

In my previous post, I showed how to create the Excel template for a Dodeca relational view.  In this post, I will complete the series by creating the SQLExcel view that will join together the SQLPassthroughDataset from part 1 and the Excel template from part 2 to display and summarize Essbase performance data.

To create the new, select the New button from the View Editor to see the New View dialog.  I gave my view the ID and Name ‘Essbase Performance’ and chose the SQLExcel ViewType.


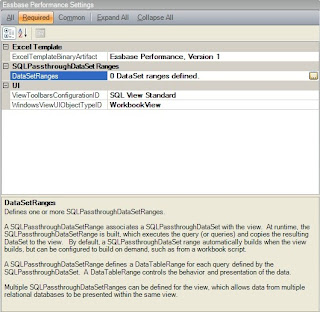
Once the view is created, the property set for the new view is displayed in the editor.  There are four mandatory properties for this view type.   The ExcelTemplateBinaryArtifact property is an object that wraps the Excel file that is used as the template for the view.  The ViewToolbarsConfiguration and the WindowsViewUIObjectTypeID specify the set of toolbars to use for the view and the type of display window.  The WorkbookView WindowsViewUI specifies the view to be rendered with a single workbook resized to the entire size of the view window.

The most important property, however, is the DataSetRanges property. The DataSetRanges property specifies the data to be retrieved along with the sorting, grouping and other display options.


The DataSet Range editor is used to specify one or more data set ranges that will be retrieved into the worksheet or workbook.  In turn, each DataSet may contain one more DataTables.  Each DataTable contains the data retrieved from a single SQL statement.


The DataTableRanges property is defined where each DataTable is placed on the worksheet.


This dialog dictates how and where the data is place into the worksheet.   The key property is the DataSheetRangeProperty which defines where the rows returned in the DataTable are placed into the worksheet.  Optionally, the data rows can exclude column headers and can insert cells into the range. This latter setting is very useful when you want to use Excel formulas in your group subtotal blocks as it is the key to having the spreadsheet engine automatically adjust the formulas.   The GroupStartCell property specifies where Dodeca will start building the group blocks, if any.  The groups are specified using the RowSortAndGroupByInfoList property.  The editor for the RowSortAndGroupByInfoList specifies, obviously, how the rows are sorted and grouped.


The RowSortAndGroupByInfo Editor not only specifies the sorting and grouping of the data, but also specifies the Excel Outlining configuration and the range name used to identify the block.  With these point and click configurations complete, here is what the completed view looks like.


The completed view shows metric information about the Essbase operations conducted through Dodeca.  Essbase administrators have, over the years, tried to get this type of information by parsing the Essbase logs.  Dodeca, however, provides a much simpler solution.

Monday, September 13, 2010

Relational Functionality of Dodeca 5.0 - How To, Part 2

In my previous post, I covered the first part of three parts on how to create and deploy a relational view in Dodeca.  In this post, I will cover creation of the Excel template.  For my example, I am going to write a simple report from the Dodeca Essbase Performance logging table.

Dodeca exposes a tremendous amount of Excel functionality to the relational view type.  One of the most common things that most customers leverage is the ability to use Excel formulas in the subtotal blocks.  One of the challenges most developers have when adding formulas, such as the SUM() function 'on-the-fly', is determining the range address for the formula.  We made it very easy to use formulas as we insert rows to contain the actual data.  This approach leverages the built-in spreadsheet functionality which adjusts the range addresses automatically.

Another useful Excel functionality that is available in Dodeca is grouping.  Grouping provides users a way to tie a range of cells together so they can be easily collapsed or expanded.  It supports the ability to automatically sort and group data based on column values and expressions.  Additionally, up to 8 levels of grouping is supported and each level can be configured to initially display expanded or collapsed.

The requirements for the Excel template are simple.  First, there must be a range defined for the data.  The range must be exactly the number of columns returned by the SelectSQL of the SQLPassthroughDataSet object.  The range must also be exactly 2 rows tall or, if you intend to show the column headers returned by the relational query, exactly 3 rows tall.   This range can optionally contain formulas which will automatically be both preserved during the retrieve process and copied to each data row inserted into the worksheet.

Optionally, you can also include subtotal blocks.  The subtotal block typically includes the entire data range and may include one or more rows, and or one or more columns, before and/or after the data range.  This subtotal block typically contains formulas and labels to summarize the detail rows contained within the data range.

The range names should be defined with sheet level scope.  Sheet level names are mandatory when the relational view is cascaded.  Here is a screen shot showing the data range name definition.

DataRange definition in the Excel template


For my example, I am going to insert subtotal blocks to summarize the operation and break on the server / application / database.  The operation block will contain a row for the average, minimum and maximum values for each operation.   Here is my completed spreadsheet template.

Completed spreadsheet with OperationBlock range selected


In the final post of this series, I will setup the SQLExcel view that will join together the SQLPassthroughDataset from part 1 and the Excel template from part 2 to display and summarize Essbase performance data.